Labour & Demography
Labour and demographic trends, including changes in employment, unemployment and participation rates as well as population and projected population by age.
Labour market
-
Employment and unemployment, South Australia, trend series
March
2023March
2024Change Employment ('000)
Full-time 621.0
610.3
-10.7
Total 939.3
942.2
+2.8
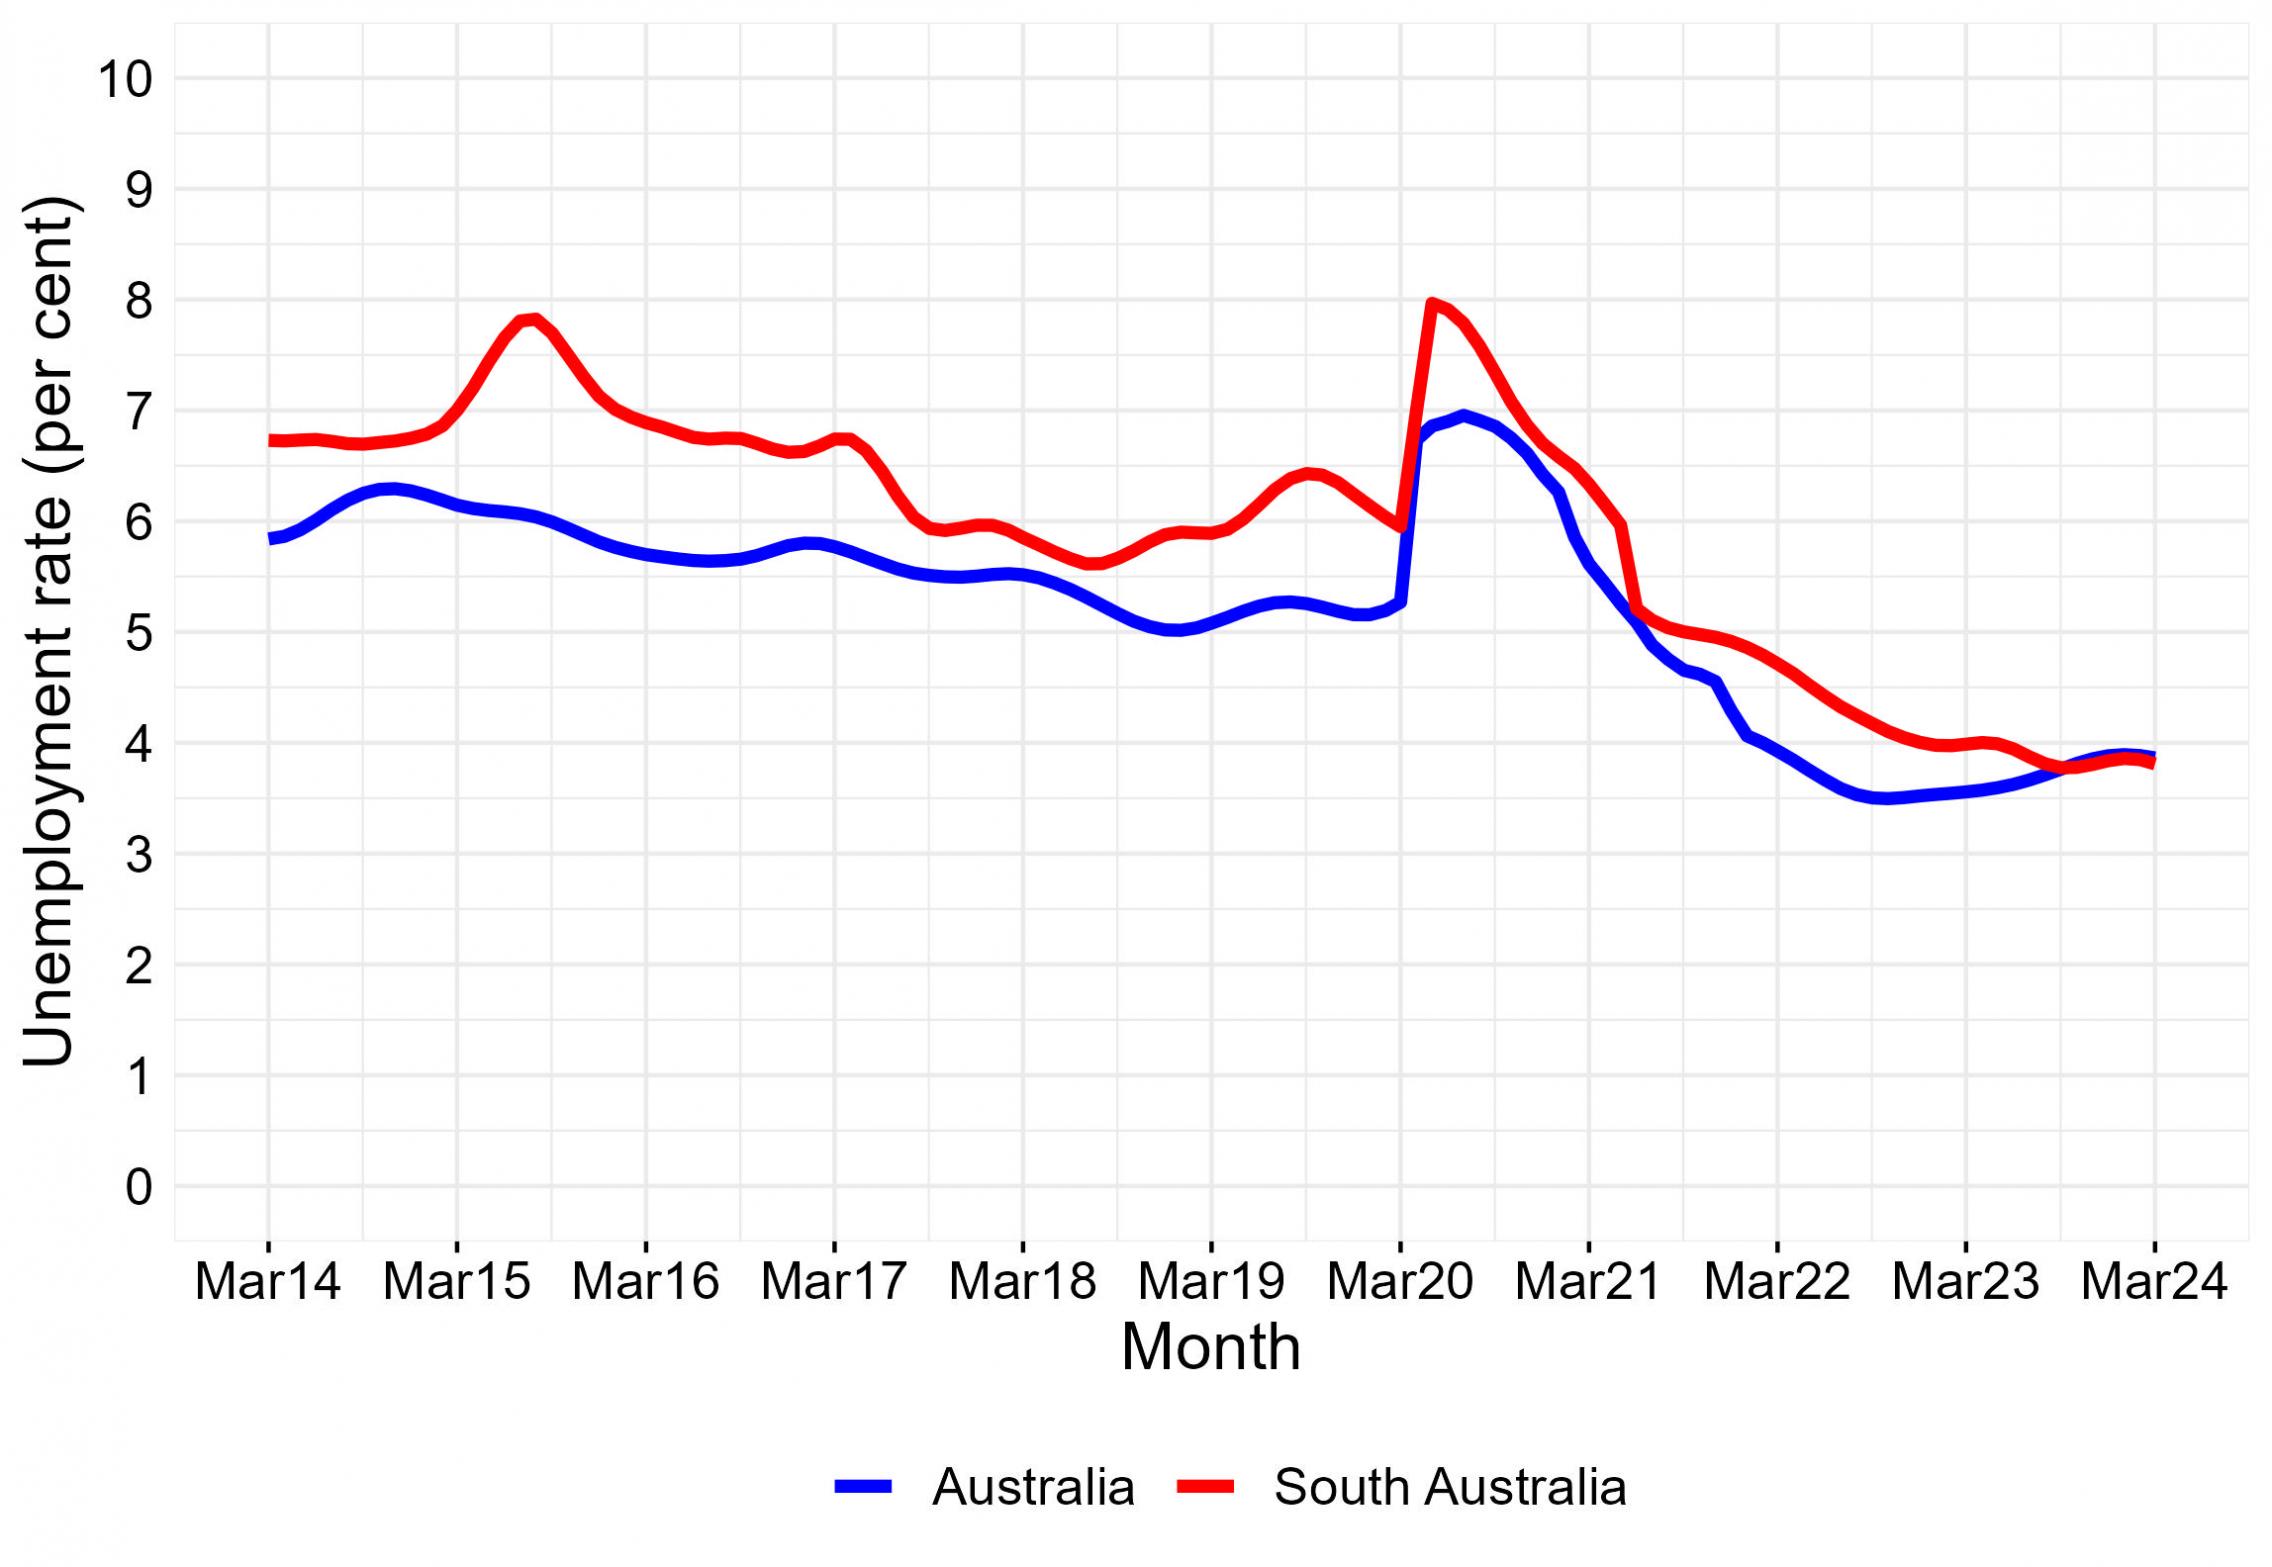
Unemployment and Participation Rates (per cent) Unemployment Rate 4.0
3.8
-0.2
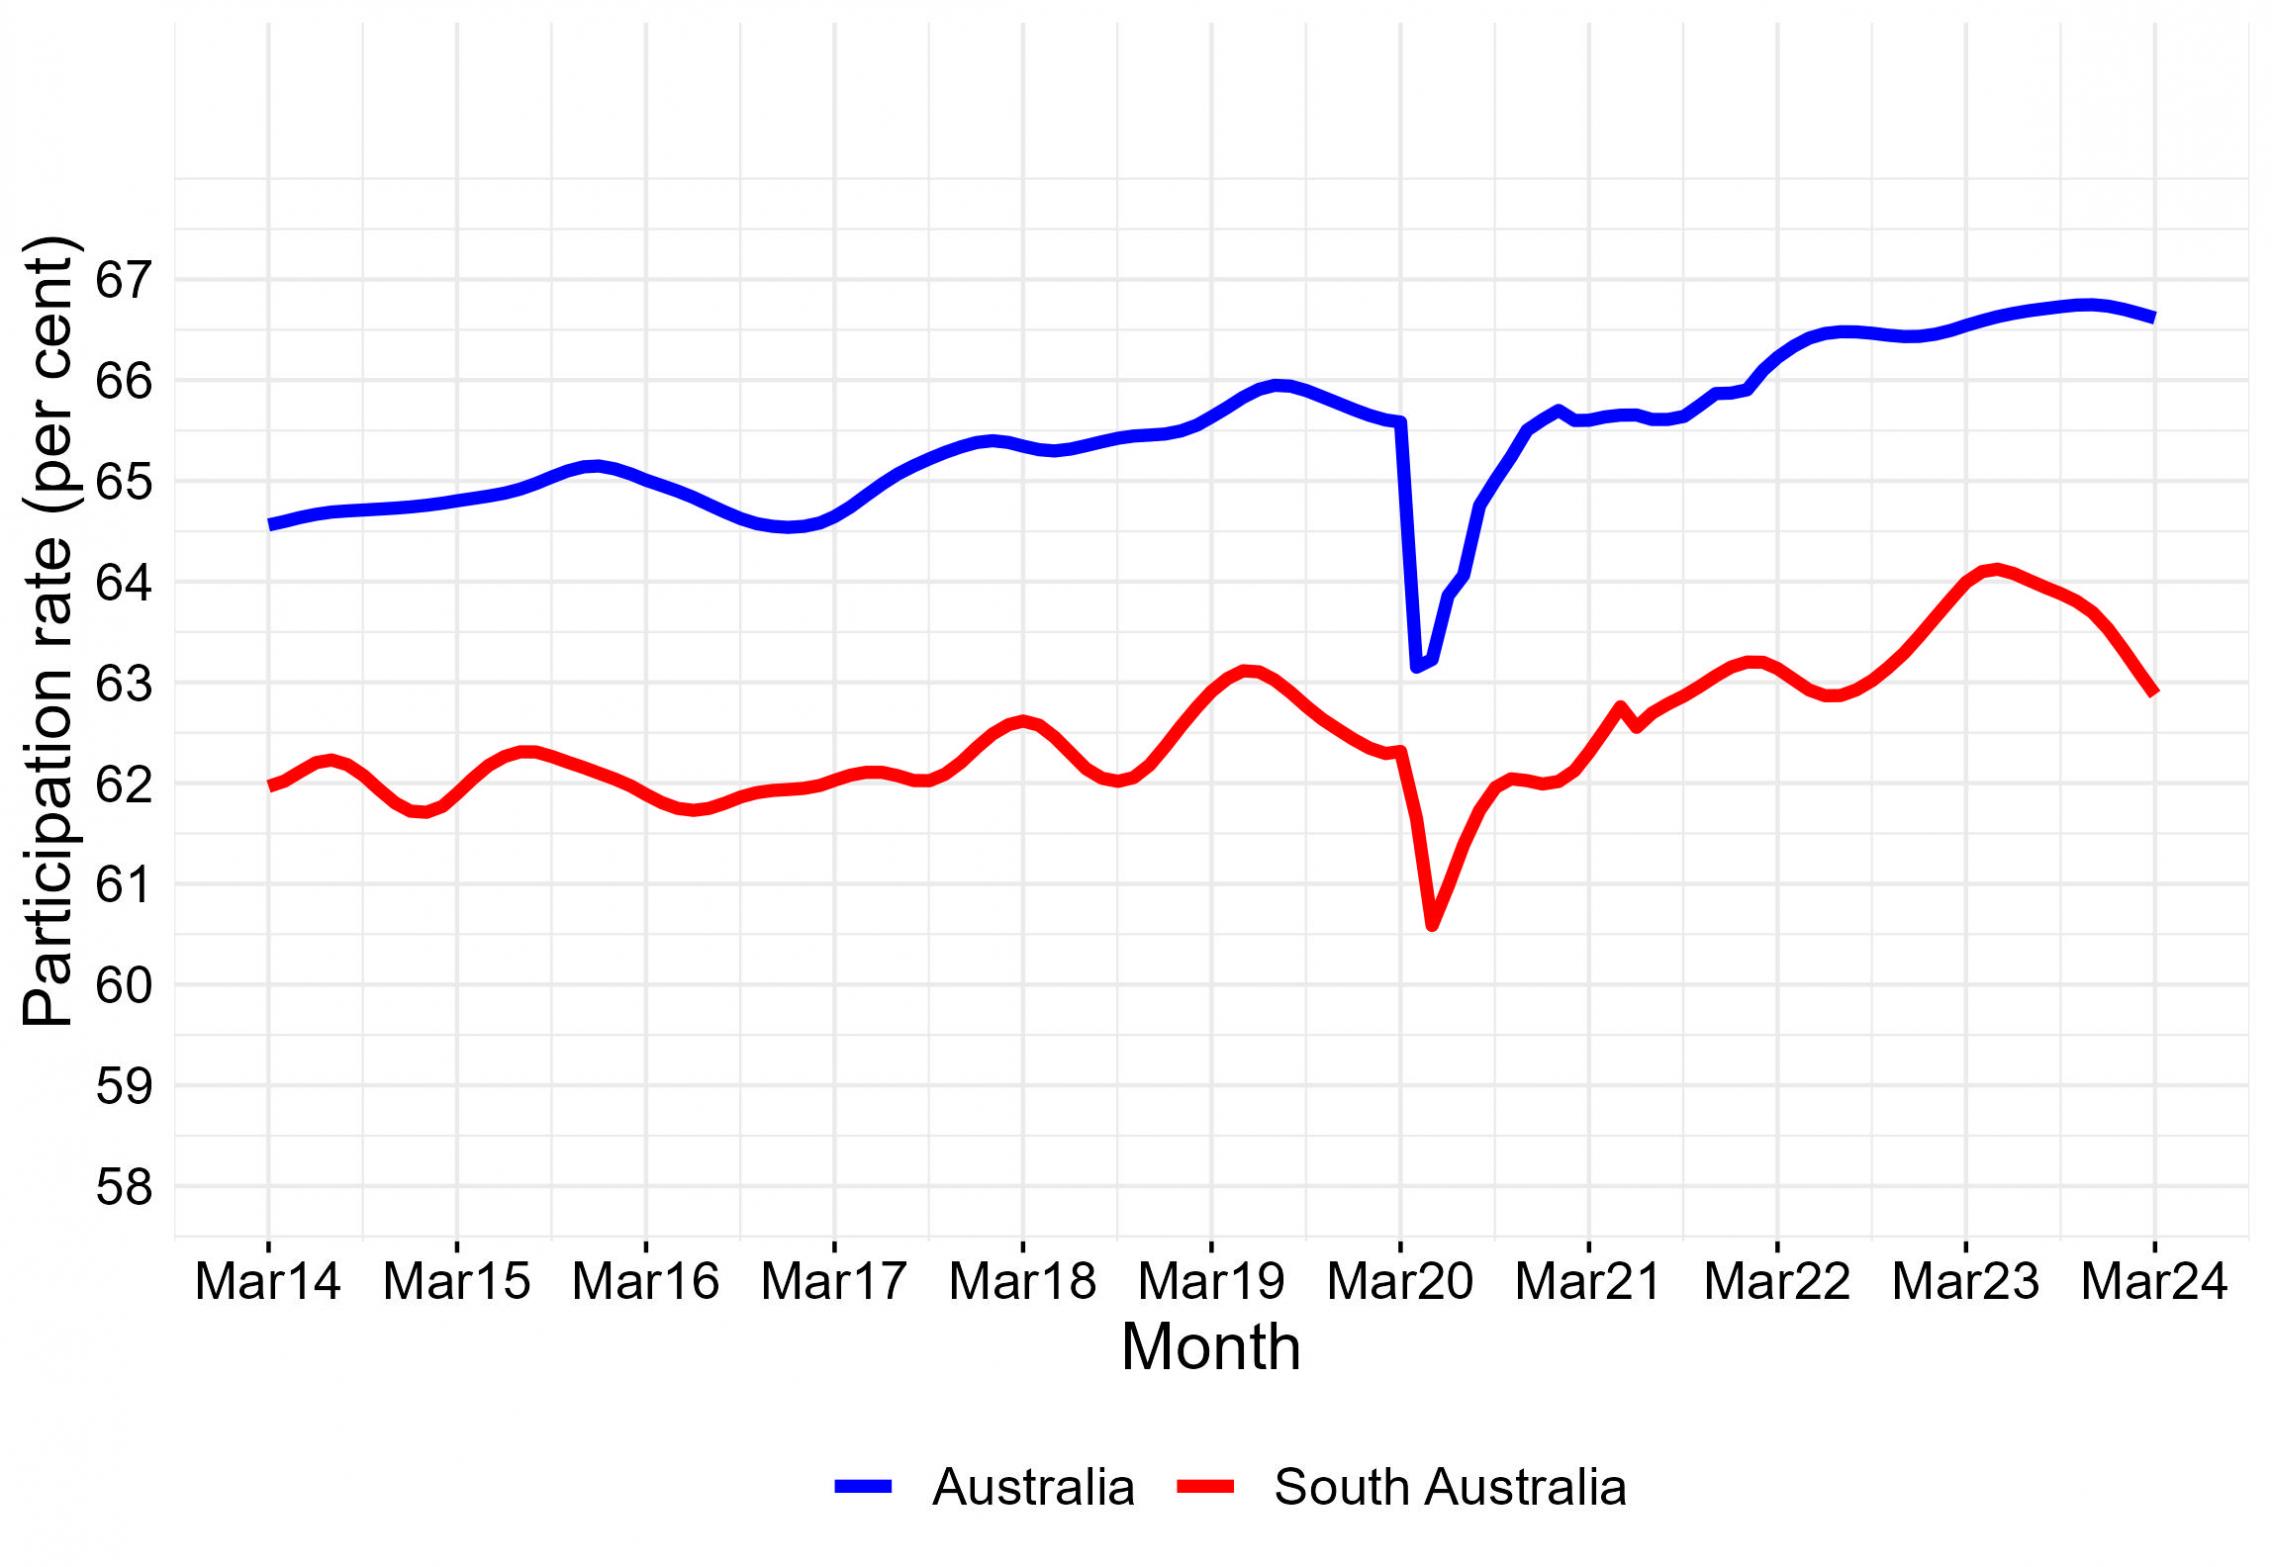
Participation Rate 64.0
62.9
-1.1
Note: Change may not be equal to the difference in reported numbers due to rounding.
Source: ABS, Labour Force, Australia, Cat. No. 6202.0. -
Unemployment rate, monthly trend series
-
Participation rate, monthly trend series
Demography
-
Population change, South Australia
2020 2021 2022 Components of Population Change (Persons) Natural increase +4,510 +5,377 +3,999 Net overseas migration +4,056 +1,114 +23,857 Net interstate migration +2,348 +2,310 +670 Total net population change +15,586 +11,235 +28,526 Estimated Resident Population (end of year) Persons 1,794,514 1,805,749 1,834,275 Source: ABS, Australian Demographic Statistics, Cat. No. 3101.0. Calculations by SACES.
-
Projected population by series* South Australia, 2022 to 2071
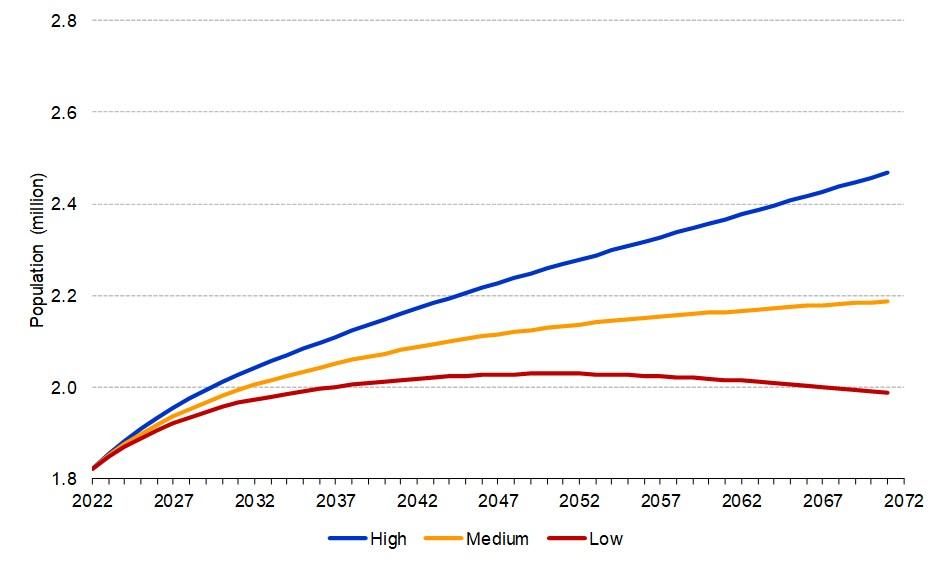
Note: * The population projection series are influenced by different assumptions related to fertility, life expectancy for males and females at birth, net overseas migration, and net interstate migration. The "high" series typically incorporates higher values for these components, such as increased life expectancy and fertility rates. However, it is important to note that the "high" and "low" series do not correspond directly to the maximum or minimum possible population outcomes. For instance, in the case of South Australia, the "high" series assumes the most substantial negative interstate migration (since South Australia typically experiences negative interstate migration). For the assumptions underlying each series, refer to the Australian Bureau of Statistics (ABS).
Source: ABS, Population Projections, Australia, 2022 (base) - 2071.