Industry Level Indicators
Industry level indicators, including for retail trade, building and construction, agriculture and mining, and data on overall industrial structure of the economy.
Household spending
-
Household spending, current price estimates, May 2025
Monthly change (%) Annual change (%) South Australia 0.1 4.0 Australia 0.2 4.0 Note: Monthly trend current price measures. Annual change refers to percentage change between the latest month and the corresponding month from the previous year.
Source: ABS, Monthly Household Spending Indicator.
Building and construction
-
Construction work done, real estimates, preliminary, March quarter 2025
Quarterly change (%) Annual change (%) South Australia 1.6 3.3 Australia 0.7 3.2 Note: Quarterly trend chain volume measures. Annual change refers to percentage change between the latest quarter and the corresponding quarter from the previous year.
Source: ABS, Construction Work Done, Australia, Preliminary, Cat. No. 8755.0. -
Building approvals, percentage changes, through year, trend estimates
No. of dwelling units approved
(May 2025*)Value of building approved
(May 2025*)South Australia 27.9 22.0 Australia 9.8 20.4 Note: * Refers to percentage change from corresponding month a year earlier. Value of building approved includes residential and non-residential buildings.
Source: ABS, Building Approvals, Australia, Cat No. 8731.0.
Agriculture
-
Winter crop production, ABARES*
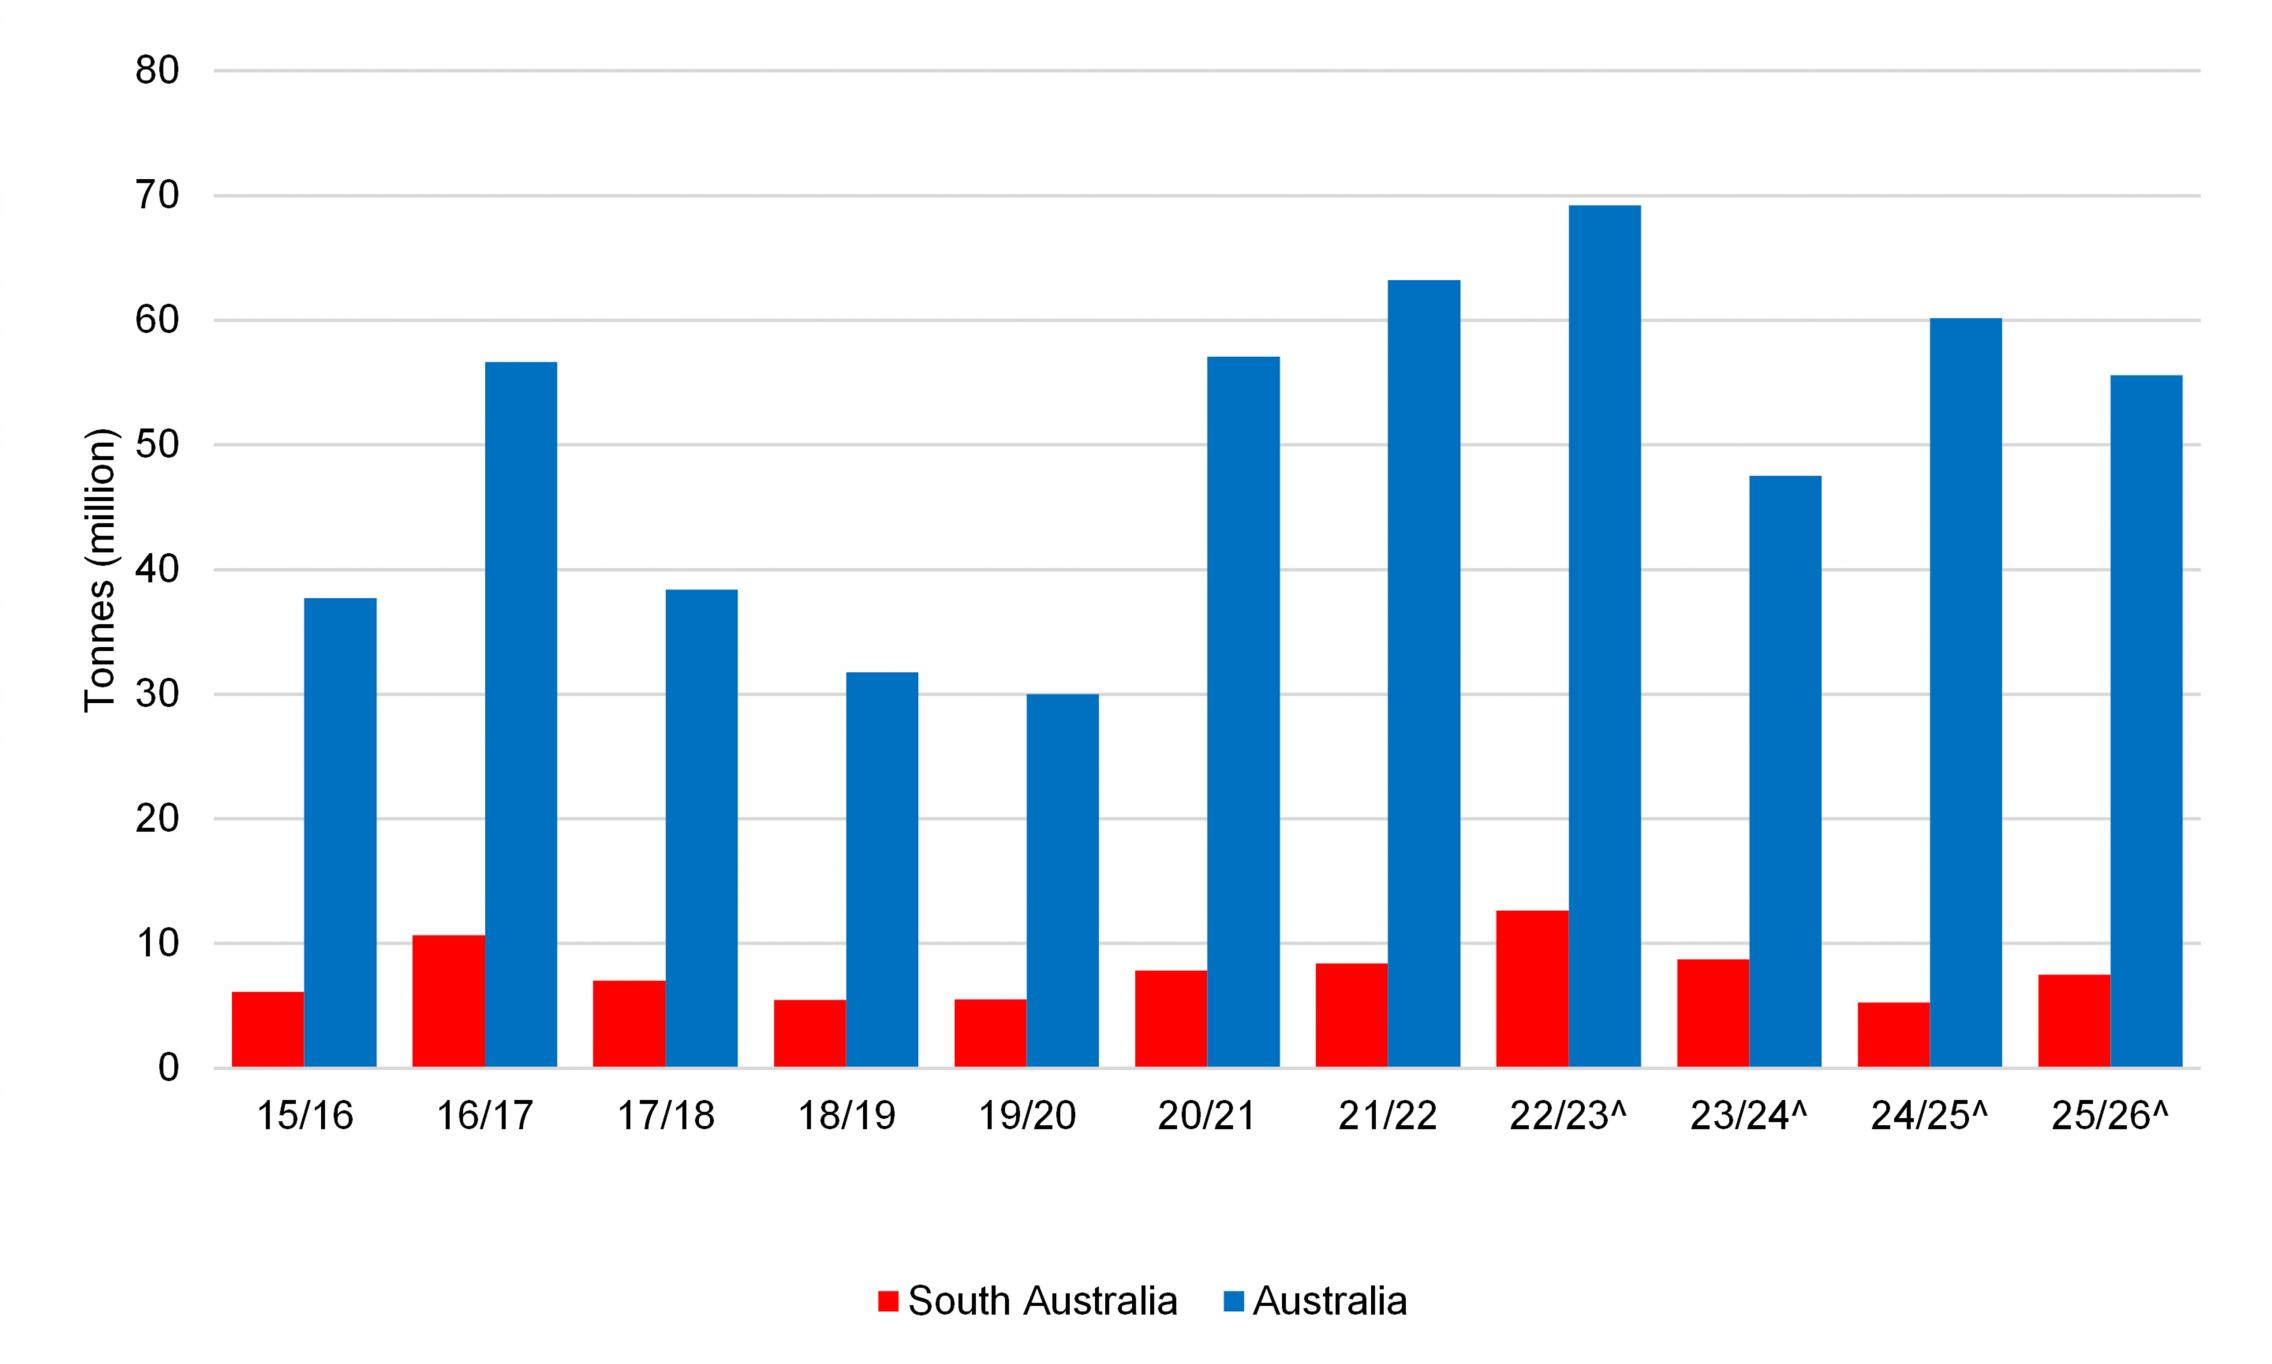
Note: * Winter crop production includes barley, canola, chickpeas, faba beans, field peas, lentils, linseed, lupins, oats, safflower, triticale and wheat. ^ ABARES estimates for 2022/23 and 2023/24, and forecasts for 2024/25 and 2025/26.
Source: Australian Bureau of Agricultural and Resource Economics and Sciences, Australian Crop Report, No. 214, June 2025.
Mining
-
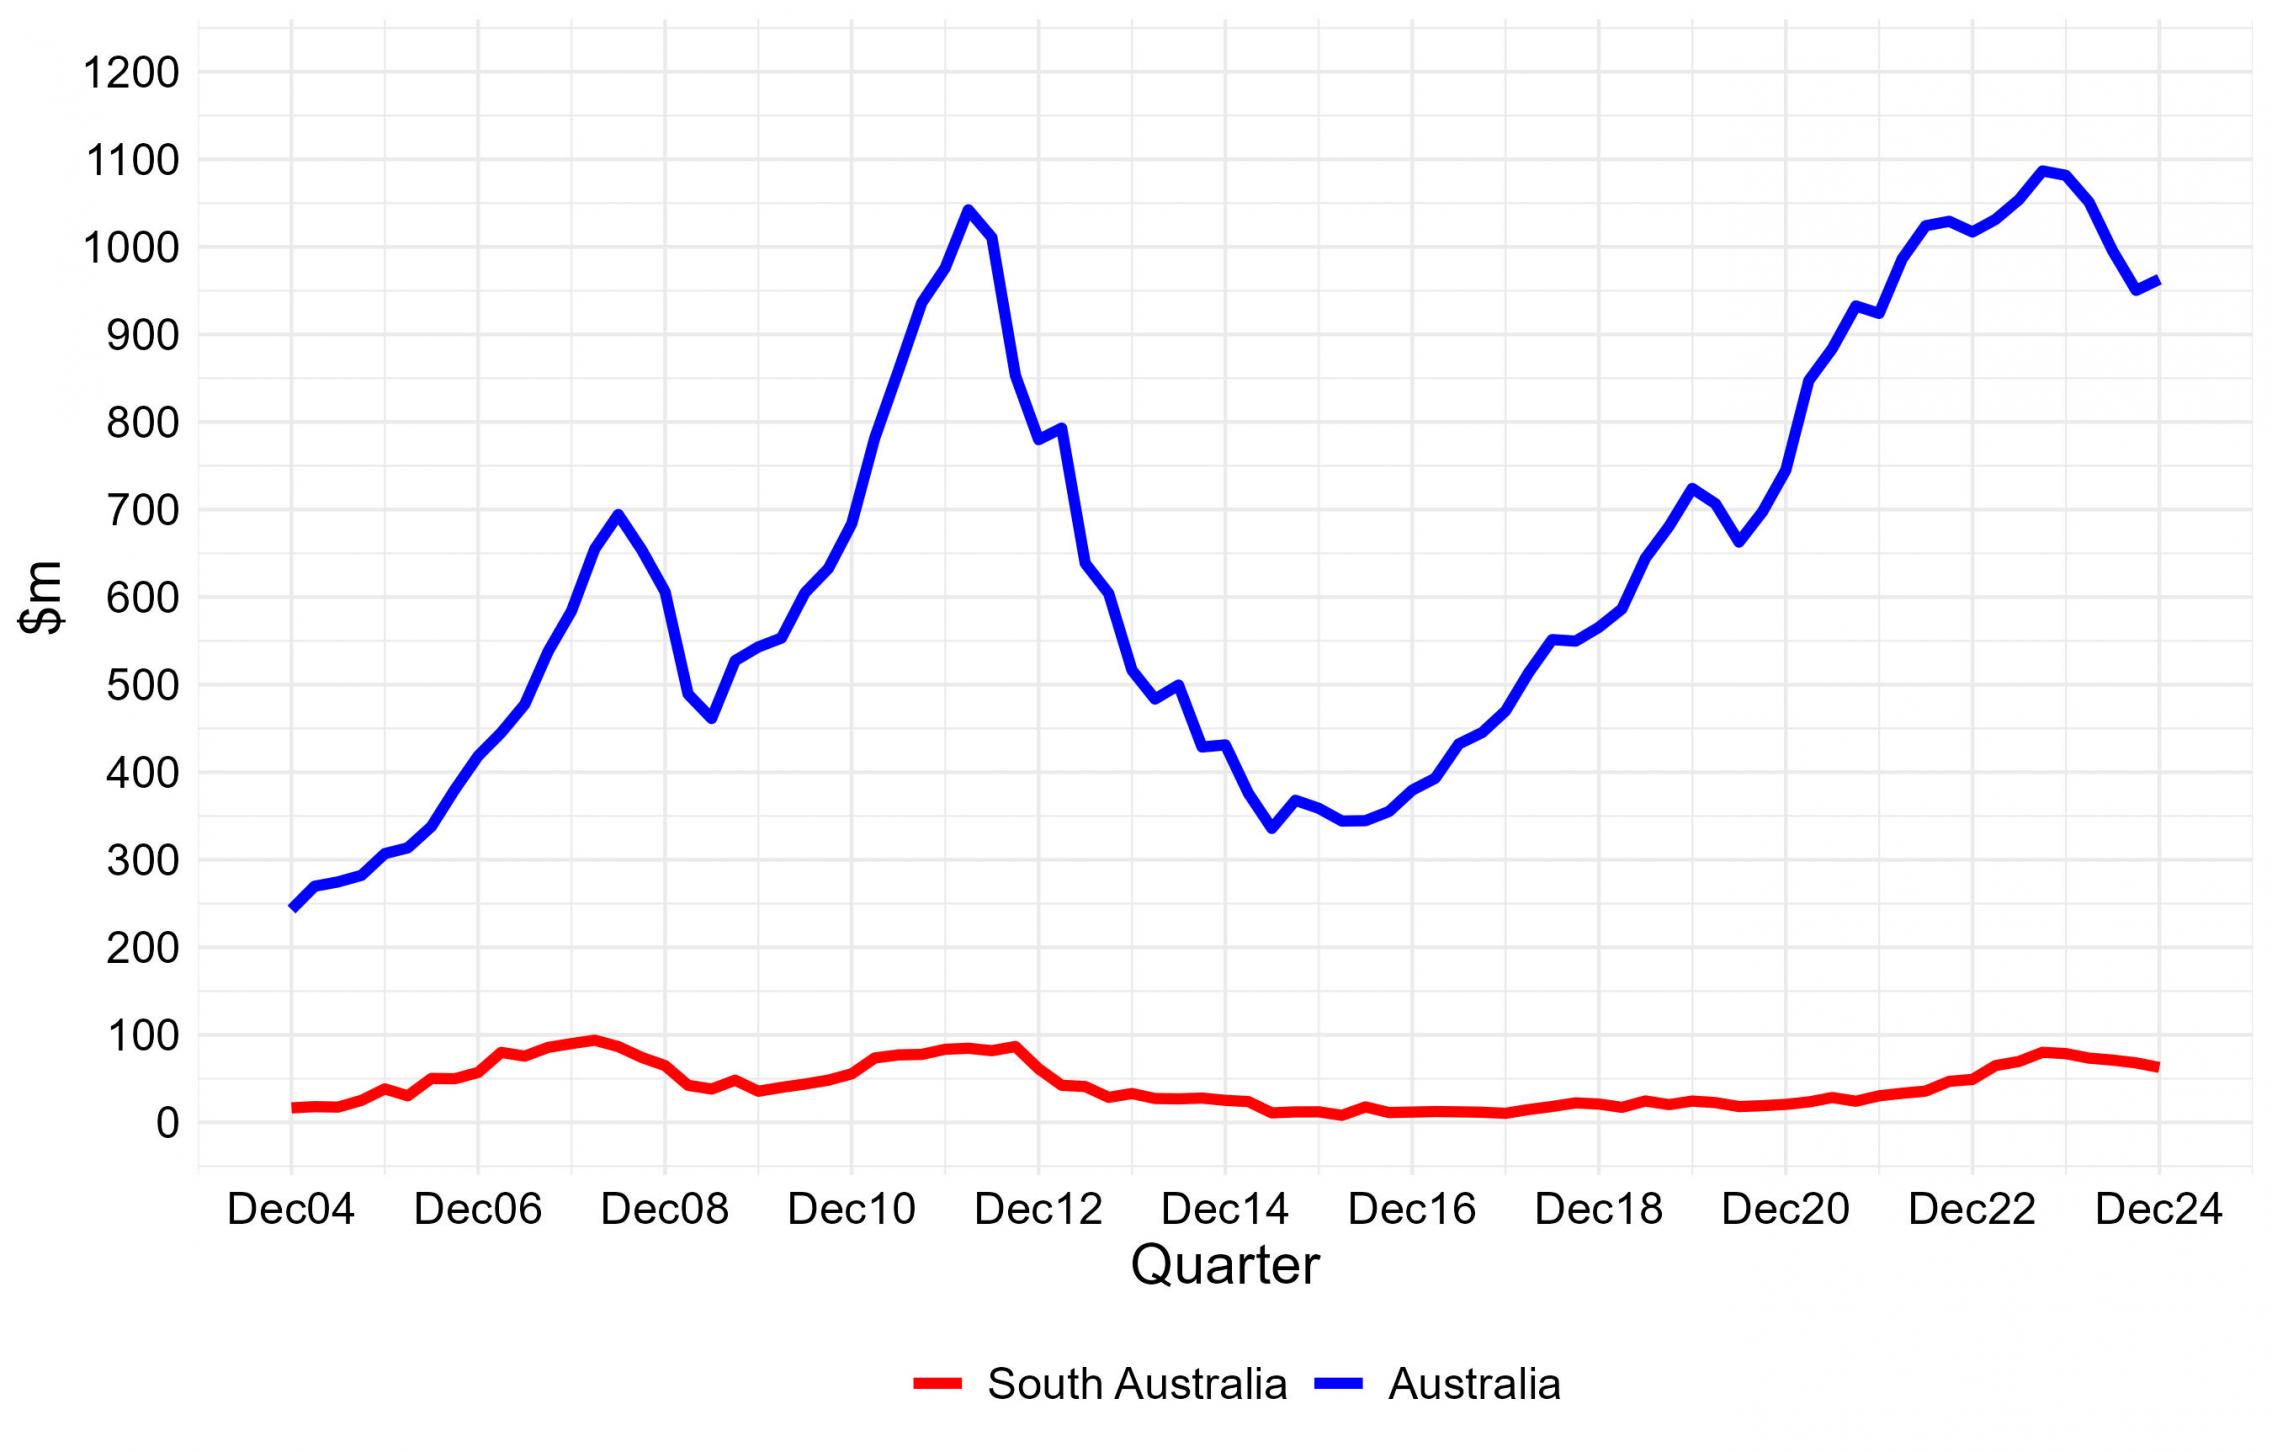
Mineral exploration expenditure by State and Territory ($m)
2018 2019 2020 2021 2022 2023 % change % change 2022 to 2023 2018 to 2023 NSW 247 296 288 300 351 367 4.5 48.3 VIC 94 113 153 219 201 152 -24.5 62.2 QLD 304 354 408 445 555 592 6.6 95.1 SA 76 87 80 107 165 293 77.9 285.2 WA 1,318 1,648 1,758 2,351 2,547 2,599 2.1 97.2 TAS 22 16 11 21 41 39 -5.1 80.5 NT 123 133 111 154 200 228 14.1 85.1 AUST 2,184 2,648 2,809 3,596 4,060 4,270 5.2 95.5 Source: ABS, Mineral and Petroleum Exploration, Australia, Cat No. 8412.0.
-
Petroleum exploration expenditure
2018 2019 2020 2021 2022 2023 Expenditure for the year ($m) South Australia 118 100 127 111 n.a. n.a. Australia 1,140 1,363 1,000 1,122 985 1,058 Change from previous year (per cent) South Australia -15.8 -15.1 27.7 -13.2 n.a. n.a. Australia -6.6 19.6 -26.7 12.2 -12.1 7.4 Note: Derived from quarterly seasonally adjusted estimates. n.a. = data not available for publication.
Source: ABS, Mineral and Petroleum Exploration, Australia, Cat No. 8412.0. -
Mineral exploration expenditure, quarterly